SaralUPSC
  • Home
  • Blogs
  • Prelims Questions
  • Mains Questions
  • Tests
Start Free Test
SaralUPSC

Saral Preparation Pvt. Ltd.

Delhi, India

support@saralupsc.com

Toll Free: 1800 000 0000

Office Hours: 10 AM – 7 PM (All 7 days)

Company

  • About Us
  • Careers
  • Contact Us
  • Media
  • Sitemap

Products

  • Test Series
  • Live Quizzes
  • Notes
  • Videos
  • Blog

Useful Links

  • Prelims Questions
  • Mains Questions
  • Free Tests
  • Sign Up
  • Login

Follow us

© 2026 Saral Preparation Pvt. Ltd.. All rights reserved.

  • Privacy
  • Terms
  • User Policy
  1. Home
  2. /Prelims Questions
  3. /Miscellaneous
  4. /Question
Miscellaneous·2018·Easy

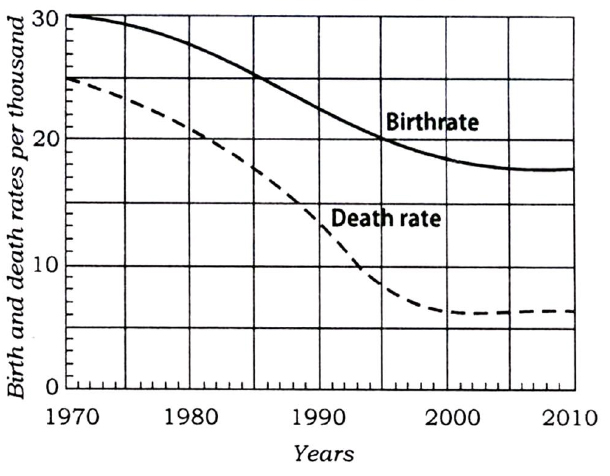
Looking at the graph, it can be inferred that from 1990 to 2010

Looking at the graph, it can be inferred that from 1990 to 2010

Options

  1. a.

    population growth rate has increased

  2. b.

    population growth rate has decreased

  3. c.

    growth rate of population has remained stable

  4. d.

    population growth rate shows no trend

    Correct answer

Explanation

By carefully examining the data from 1990 to 2010, we can observe a pattern where both the birth rate and death rate initially decrease, followed by a stabilization. Therefore, option (d) appears to be the most appropriate answer.
Share

  • Share on X
  • Share on WhatsApp
  • Share on LinkedIn

Related prelims questions

  • For election to the Lok Sabha, a nomination paper can be filed by

    Miscellaneous · Easy

  • In a month if the seventh day is three days earlier than Saturday,then the nineteenth day of the month will be a

    Miscellaneous · Easy

  • Which among the following events happened earliest ?

    Miscellaneous · Easy

  • An 80-litre solution of alcohol and water has 75% alcohol. How much water (in litres) must be added to bring down the concentration of alcohol to 60%?

    Miscellaneous · Easy